Table of Contents
Product analytics definition
Product analytics is a set of tools that help with the process of collecting and analyzing digital product usage data. You can use this data to better understand customers and how they interact with product features.
It’s important to measure your product’s technical performance alongside these types of usability metrics to get a complete picture of how the product is performing overall. Going beyond this quantitative data to analyze customer needs and other factors that drive their behavior helps teams improve the product and user experience.
If you work in a role within what we call the product team — for example, as a product manager, developer, UX designer, or marketer — then your goal is to create the best product you can for your users. You want your digital product to be useful, engaging, and easy to use.
A product analytics solution is one of many tools that can help you deliver on this goal by providing insights into user needs and behaviors, which product features your users are using (or not using), what new features to prioritize or existing features to improve, and more.
What is product analytics?
There are a lot of seemingly very different tools that all claim to provide product analytics. So what even is product analytics?
As mentioned above, product analytics encompasses a variety of tools, all aimed at helping you understand how people use your digital product. These tools all deliver something slightly different. For example:
- User behavior analytics tools: Monitoring user behavior on websites or applications provides visibility into how people interact with your product, where they experience frustration, whether features are being used in the way you expected (or at all), and much more
- A/B testing tools: Using A/B testing tools to evaluate how different feature updates, UI changes, and other tweaks to your product affect KPIs and user behavior can help inform product decisions and ensure you’re headed in the right direction
- Customer feedback tools: Collecting customer feedback through support chats, feedback forms, and other methods opens a direct line of communication between your team and your end users
- Data visualization tools: Seeing data displayed visually can help you more easily identify trends and anomalies
The next question is, how do you select the right product analytics tool to meet the diverse needs of different parts of your team? You need to think about what core features you need and what metrics you want to measure.
Core features to look for in product analytics tools
There are some general features that any good product analytics tool should have, but you should also look for a few other key capabilities that will help ensure your team gets maximum value from the tool. The product analytics tool you choose should let you:
- Tag and monitor events so you can track user actions easily — ideally without having to rely on engineers to tag events in code for you
- Measure and evaluate user interactions with product features
- Test the impact of major or minor changes in product design, marketing campaigns, and other areas
- Replay user sessions to understand the “why” behind your analytics and see exactly how real users experience your product
- Identify where users experience friction or frustration
- Filter and search through collected data to quickly find the information you need
- Segment users into cohorts for a more thorough understanding of what different user groups need and how they behave
- Receive real-time alerts and notifications for relevant or severe issues
- Set up and customize dashboards that help you visualize data to quickly identify patterns and problems
- Keep data secure and protect user privacy while still collecting the necessary information to resolve errors and improve your product
- Collaborate effectively across teams
Ideally, the right product analytics solution will let you do all of the above, minimize impact on your product’s performance, and cut through noisy data so you can focus on the most impactful areas.
Key metrics to measure with product analytics
There’s a wide variety of product metrics that can help you measure how customers are interacting with your product. Here are some key metrics you should track:
- Engagement analysis: Inspect metrics such as new and returning users, time spent on a page, resource downloads, pages viewed per session, and much more to get a clearer picture of how engaged your users are
- Retention analysis: Track how your returning users behave over time and across multiple sessions. How often do returning users complete key actions, for example? How long do they remain active? Gain insights on users who behave the way you want them to, as well as those who don’t, and why
- Cohort analysis: Collecting demographic data — along with traits like the date an action was taken, use of product features, and other information you can use to organize your users into cohorts — can help you better understand the behavior of particular groups and adjust your product strategy to address each cohort’s needs
- Churn analysis: Even a small amount of attrition can be expensive for your business. Understanding what causes users to stop using your product — frustrating bugs, missing product features, poor usability — can help you reduce churn and prevent these kinds of losses
- Conversion funnel analysis: Collect data that helps you understand how users progress through key steps that you’ve defined in the user journey. How do they interact with different elements? What step do they drop off at, and why? Examine the number of users in any stage of the funnel, what happens when you apply various conversion optimization strategies, what hurts conversion, and more
- Milestone analysis: Map out all the key touchpoints a user will experience throughout their journey. Keep track of how users interact with those touchpoints to better understand what drives their behavior, identify challenges they may experience, and discover opportunities to optimize their journey at each milestone
It's important to identify and track the metrics that will provide the most meaningful insights into your product, your end users, and how to become more efficient.
Why do we need product analytics?
Product analytics can provide crucial insights into what you're doing well and how you could further improve your product and user experience. This can help you focus your time and resources on the issues and opportunities that are likely to have the biggest impact on your users.
See how and why users engage (or don’t) with product features
A lot goes into developing product features. You want to make sure people are using these features and understand how they're engaging with your product. Product analytics can help you improve feature adoption and optimize existing features.
“If there’s an issue with a new feature we’re rolling out, we can get to fixing it immediately. Not waiting for the customer to say, ‘I went to use some feature and it didn’t work, why is that?’ We can offer them preemptive support.” – Stas Vinitsky, Chief Architect at Tipalti
In some cases, you might find users are engaging with certain features, but not in the way you expected. Product analytics can help you quickly identify what’s happening and investigate the impact on your KPIs. If your product analytics solution offers integrated session replay, you can also determine the reason for this discrepancy, whether you need to adjust the feature, and how to do so most effectively.
Improve conversion and optimize your digital experience
You can use product analytics to monitor vital areas of your product, such as conversion funnels and high-value interaction points, and identify where users experience friction or frustration. Are users having difficulty navigating certain product features? Where and why are they dropping off in the conversion funnel?
Product analytics can help you answer these types of questions to create a smoother digital experience that prioritizes the features that are most valuable to your users — and, ultimately, to your business.
Inform your business and roadmap strategy
It can be a challenge to determine the best way to improve product features, maintain user satisfaction, and grow as a business. Product analytics can provide the right information to help you make data-driven business decisions with confidence.
“There was this feature that was very expensive to maintain. It was a great feature that both the tech team and the product team wanted to have. Looking at the data in LogRocket, we saw that there were actually not many customers using it. We figured out that it was not worth maintaining that feature. We reshaped it, making it technically easier and with a good compromise from the functional point of view.” – Marco Lanaro, Engineering Team Lead at Dojo
With the right product analytics tool, you can collaborate across teams to create the best digital experiences possible and work more efficiently towards your business goals.
Who benefits from product analytics?
Your whole team can use product analytics to better understand and interact with customers, optimize product features, and make informed business decisions.
Product managers and designers
Use product analytics for insights into how real users engage with your product and what pain points they experience. This information can help product managers and designers identify the need for new or improved features that will help people use your product and navigate their user journey more easily.
Marketers
Product analytics helps you understand not only how users are behaving and why, but also the users themselves. Identify and filter your users by name, email, or other traits to get useful insights into how specific users or user segments find you and move through the funnel.
Additionally, with referrer data and other information related to your marketing campaigns, you can get a clearer picture of how user traits and behaviors affect campaign success. Build and market a more performant, user-friendly product with insights from product analytics.
Data teams
Product analytics can help data teams accomplish many of the crucial roles they play in an organization, including informing data-driven decisions, tracking product performance and progress, surfacing issues that need to be addressed, and much more.
With the right product analytics tool, your data teams will have a single source of truth for sharing actionable insights across the company. Making this data accessible to all teams empowers them to discover opportunities to develop or improve product features and other business services.
Engineers
Deploy your engineering resources more efficiently by using product analytics to identify and resolve high-impact issues before they affect your users. Monitor alerts, errors, technical performance problems, and other product analytics data to surface issues, scope the impact, and quickly ship necessary fixes.
“LogRocket really helped us understand issues that otherwise would take us much longer, and would require us contacting the client and talking to them several times.” – Stas Vinitsky, Chief Architect at Tipalti
When users experience issues, the right product analytics tool can provide the context you need to reproduce and fix problems at their source. Get insight into the scale of the problem, as well as the technical context around what’s causing it, without needing to get more information from your users — an inefficient back-and-forth process that can be frustrating for both sides.
Customer success teams
Insights from product analytics can help customer success (CS) teams ensure that customers are satisfied with their product experience and keep coming back for more. With a clearer picture of customer motivations and frustrations, CS managers will be better equipped to guide customers through using the product effectively for their specific needs.
You can use product analytics to ensure customers get the most value out of your product, from onboarding and training to feature adoption and account expansion. This can include anticipating and removing friction during onboarding and setup, identifying other product features or areas customers could benefit from, and much more.
Customer support teams
When users reach out with complaints or feedback, it’s often challenging for them to provide the necessary context, comprehensive explanations, or other key details for customer support teams to understand and help them effectively. Product analytics, especially in conjunction with integrated session replay, can show customer support teams exactly what users saw, the technical context for why an issue occurred, how many other users were affected, and more.
“LogRocket puts less of a burden on the customer to relay everything that happened in the moment. If a customer reaches out, our support team has a recording of what the customer was doing leading up to that moment.” – Sam Siskind, Senior Manager of Customer Support at Dutchie
Customer support teams can use insights from product analytics to triage tickets, understand if an issue was caused by a user error or bug, and either route the ticket to the right department or resolve it themselves.
Your customers and end users
Product analytics can help you optimize the customer experience at every turn. The insights you gain through product analytics help ensure customers enjoy an intuitive, error-free UX. When your team needs to communicate directly with customers, either to address an issue or for general account management, they can use product analytics data to provide empathetic, attentive service that quickly and effectively addresses customer needs.
How do I start product analytics?
Though companies of any stage, size, or industry can benefit from product analytics, the role it plays may vary throughout the business lifecycle — from your launch stage to your growth phase and through reaching maturity.
During a company’s launch stage, product analytics can help guide early product development and strategy building. Consulting product analytics data to validate decisions at each stage of a product launch will help ensure you understand product usage, your users, the market, and how you plan to define and measure success.
You can use product analytics tools in your growth phase for data-backed decision-making as you iterate on your product, mitigate churn, define and analyze user cohorts, optimize the user journey, and more. This will help you minimize resource waste, maximize engagement and retention, and achieve steady, tenable growth.
For companies that have reached maturity, product analytics is crucial for streamlining operational efficiency to stay competitive in a challenging market. Using product analytics to better understand user behavior and product usage can help you increase conversions, retention, and feature adoption.
What makes product analytics challenging?
Despite the wide range of product analytics tools available, most tools come with their own set of pain points and pitfalls that you should weigh carefully.
Data capture
It can be challenging to find a product analytics tool that offers the right balance between agility and surfacing the most relevant data.
Let's say you're using a tool that requires manual tagging. You'd have to know exactly which events you want to monitor, coordinate with engineering resources to implement tagging, then wait to capture a large enough dataset before you can start analyzing it. Delays during any step of this process can cause vital issues to go unnoticed for weeks and lead to lost revenue or negative user sentiment.
On the other hand, tools that autocapture everything offer more agility, but they often produce overwhelming amounts of data to sort through, making it a challenge to find useful insights and determine which issues to prioritize. You then run the risk of wasting finite resources on fixing an issue that doesn't really matter and missing those that may have an outsized impact on critical user flows.
Lack of context
Additionally, product analytics tools that focus on aggregate analytics can capture quantifiable actions and events that you know you need to watch. However, they often lack the technical telemetry and crucial context to help you understand why an error happens or discover problems that don’t show up in traditional monitoring or error reporting tools.
Issue discovery
Product analytics tools are great for monitoring users in your digital product and how they engage. But you often need to have some ideas around what you think impacts users and what’s important to monitor, then build charts and dashboards that reflect this.
As a result, product analytics tools tend to fall short when it comes to helping you discover novel issues. What are the unknown frustration points, friction areas, or bugs preventing your users from having the best experience you can deliver?
To discover novel issues or properly scope the impact and reach of the problem before prioritizing a fix, you need a tool like LogRocket.
How LogRocket makes product analytics more efficient
LogRocket connects quantitative analytics with qualitative data to provide the insights you need to better understand:
- What drives user behavior
- The “why did that happen” behind the “what just happened” that product analytics supplies
- How users are engaging with your product
- What’s impacting your business outcomes
- Where errors are happening
- Which issues and product features to prioritize
- And much more
Additionally, since LogRocket incorporates multiple types of tools into a single platform, you can immediately and easily gather insights that you’d otherwise have to hunt for across tools — or that you’d miss altogether.
For example, since customer feedback tools collect information directly from specific customers, the responses you get may not be representative of your user base as a whole. Collating this data with other sources, such as comparing one customer’s experience with overall user behavior trends, can provide a clearer picture of factors like which product features are used the most, where the biggest pain points are, and more.
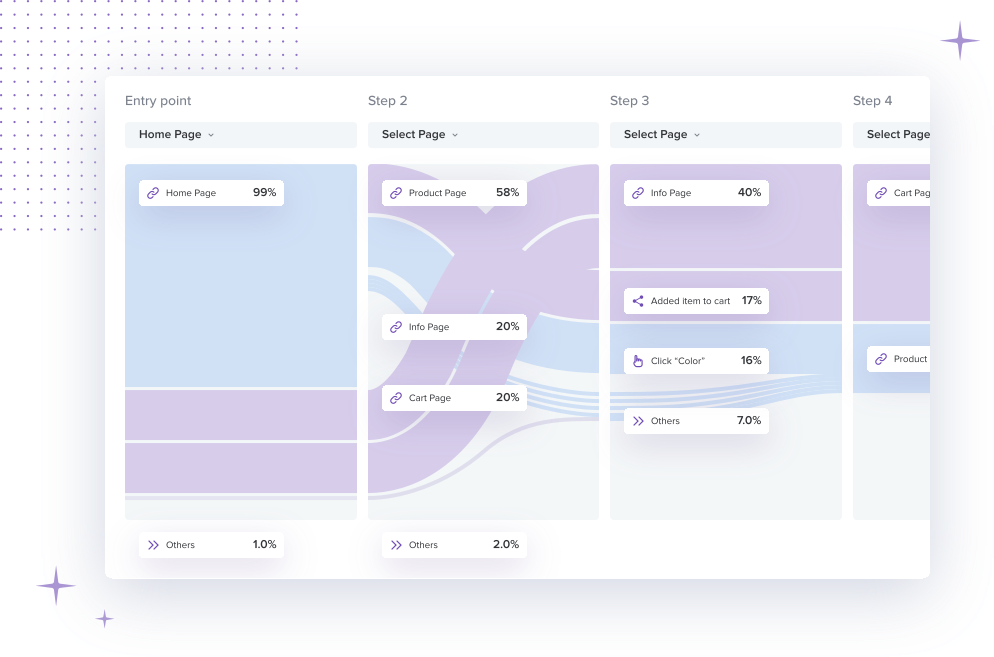
Autocapture data
LogRocket automatically captures and tracks every event, page, and action. When you create a new definition, funnel, chart, event, or anything else, this autocapture is applied retroactively, so there’s no need to wait to collect enough information to start analyzing it.
You can get instantly actionable insights from funnels, timeseries, path analyses, and more in just a few clicks instead of relying on engineering resources to tag events when there’s something new you want to track.
You can even use definitions to label pages, technical selectors, and elements in common language for use across your team.
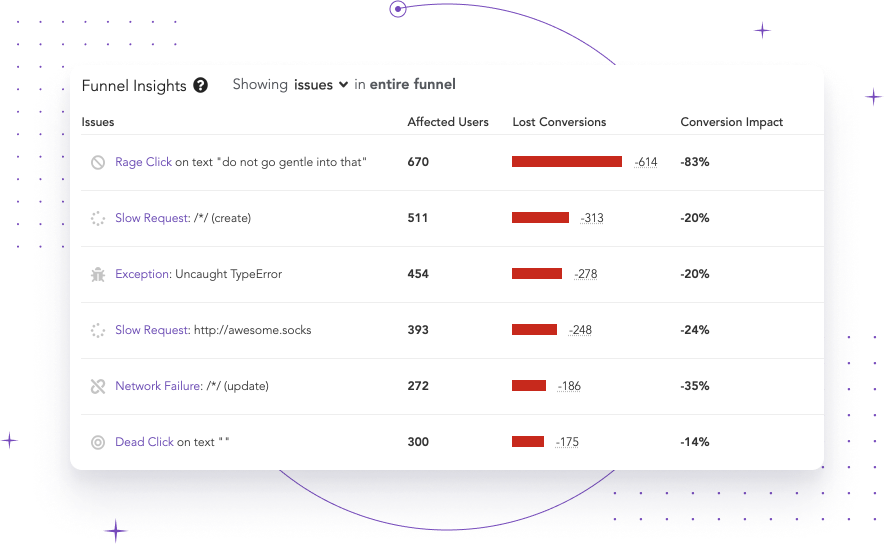
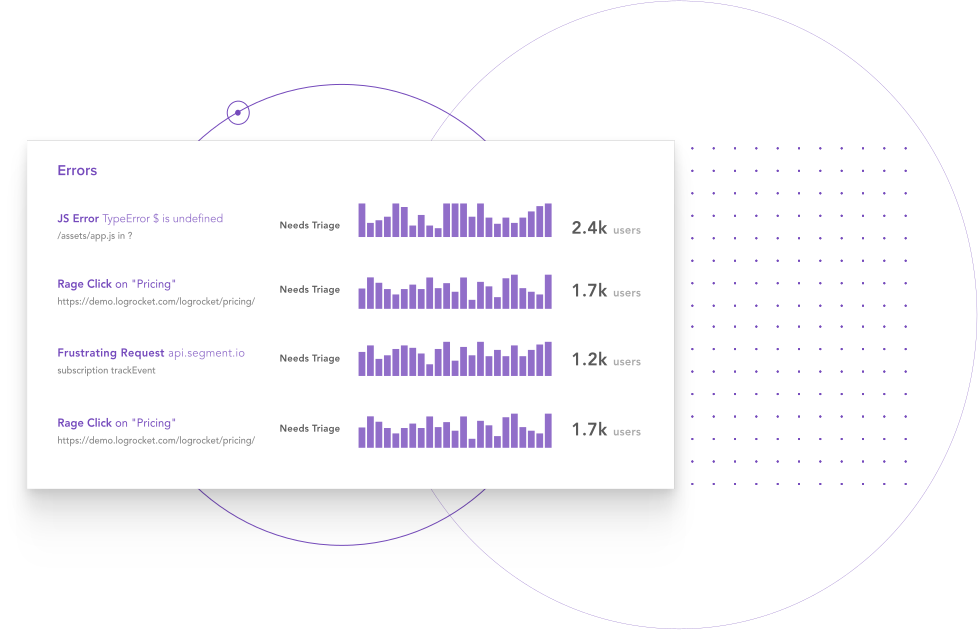
Frustration metrics
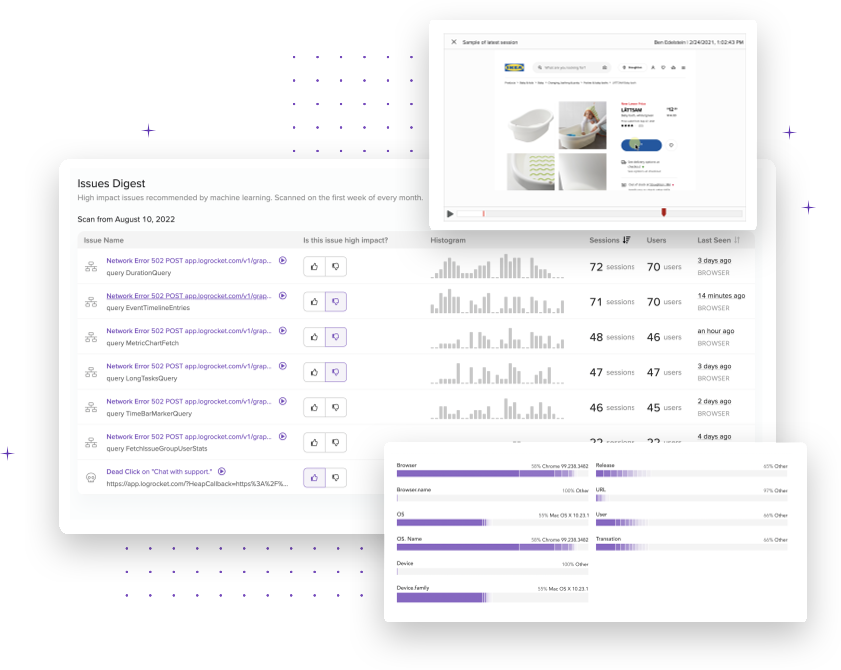
Track key metrics that indicate user frustration across your product, including rage clicks, dead clicks, frustrating network requests, and error messages.
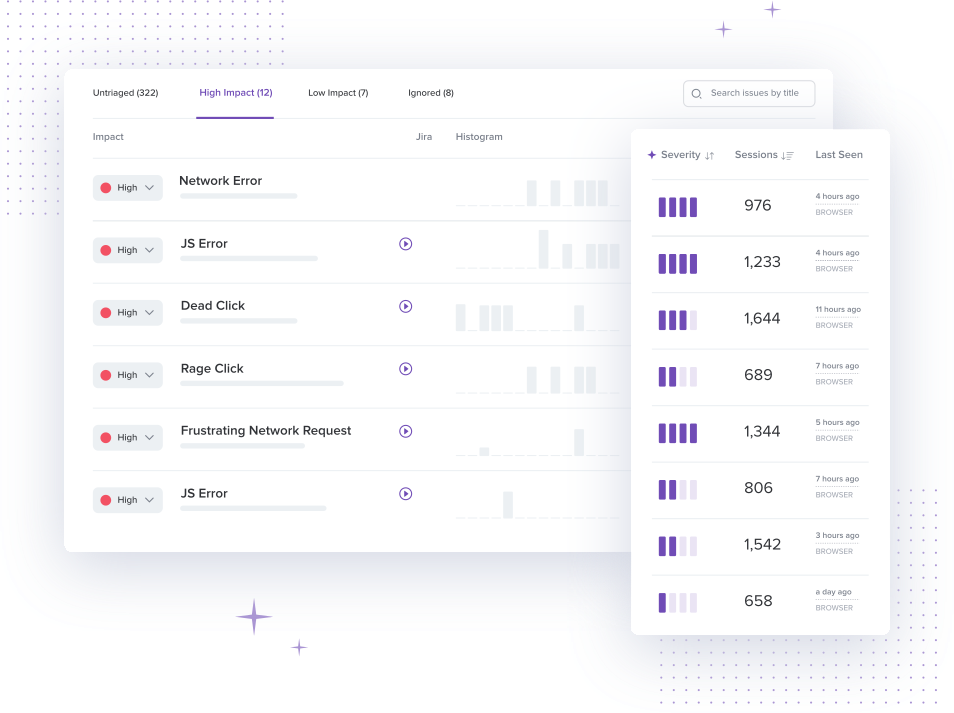
Gauge the impact of an issue with insights into how many users were affected by a problem, how often it occurs, and more. By pairing this data with LogRocket’s machine learning module, you can quickly prioritize issues by severity and collaborate across teams to resolve them.
Natively integrated session replay
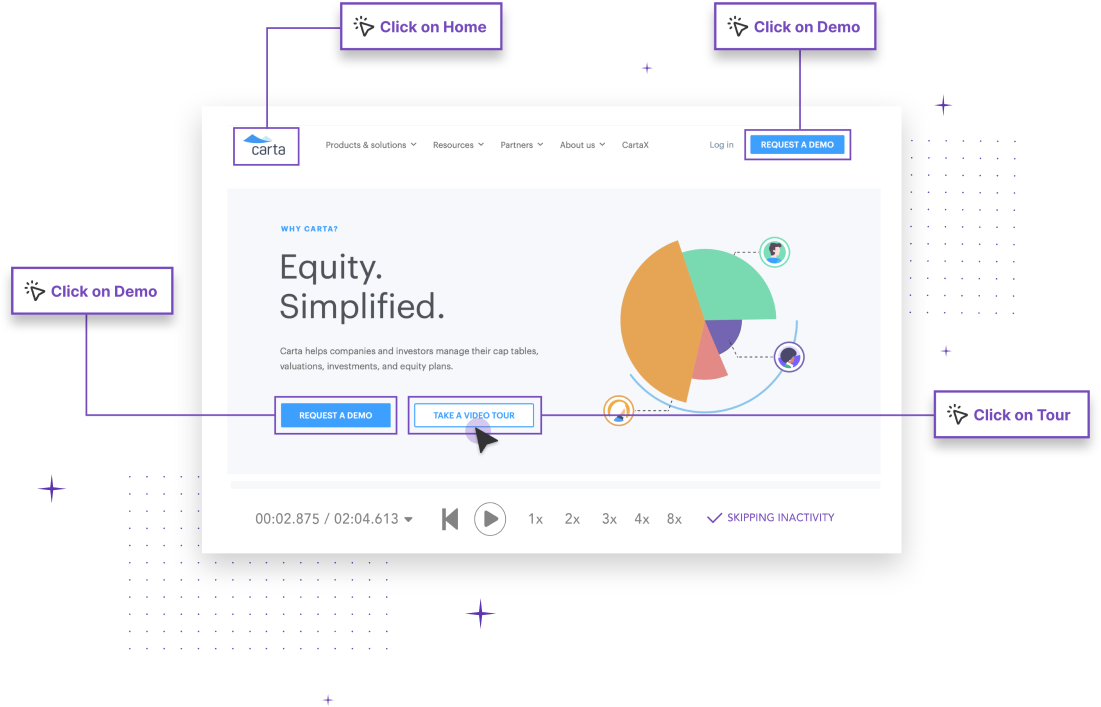
Understand exactly how users interact with your product with LogRocket’s session replay solution. LogRocket records data such as DOM tree mutations, mouse activity, network requests and responses, scrolling, taps, keystrokes, and more, using this data to create a replay of exactly what the user saw, as well as all the telemetry behind the interaction.
This broad range of recorded data is indexed and searchable, allowing you to see the context behind user actions, search through data to find specific sessions, review aggregated data to identify patterns across sessions, and receive alerts when anomalies occur.
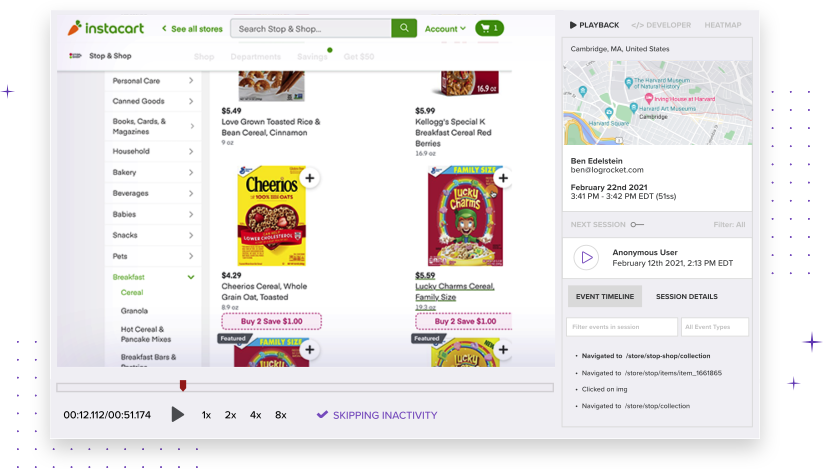
You can replay this high-fidelity visual reconstruction just like a video to see exactly what the user did and experienced, all as if it's happening in your own browser. If an issue occurs, viewing real user sessions alongside the technical context for why it happened, how many users it affected, and whether it impacted key business goals can help you quickly determine whether a bug is worth addressing and how to quickly ship a fix.
Unlike tools that only record a random sample of sessions, LogRocket's natively integrated session replay provides you with the complete picture needed to identify and resolve high-priority issues faster than ever.
Galileo machine learning module
With traditional product analytics tools, users have to monitor dashboards closely to discover any drop in KPIs. Meanwhile, existing error monitoring tools typically alert teams to every single error that occurs without distinction.
LogRocket Galileo helps cut through false positives and noise by automatically cataloging UX and technical issues, gauging the severity based on our machine learning algorithms, and proactively alerting the relevant stakeholders for issues identified as severe.
Based on over a trillion user interactions, LogRocket's Galileo machine learning module automatically identifies, aggregates, and tracks issues over time while learning from your feedback to continuously improve accuracy. This allows us to surface the most critical issues impacting your users via alerts, alongside a shortlist of the most interesting sessions to watch so you know where to focus your efforts.
"LogRocket Galileo allows us to make the most of limited time and resources. It gives us the confidence to know that we’re fixing the issues that will lead to the greatest improvement in UX, and frees our teams up to spend more time designing and building features that our users will love." – Chuck Konfrst, Director of User Experience at Cox Automotive
Discover and fix novel, high-impact issues before users complain or KPIs drop with LogRocket Galileo.
Clear visualization structures and custom dashboards
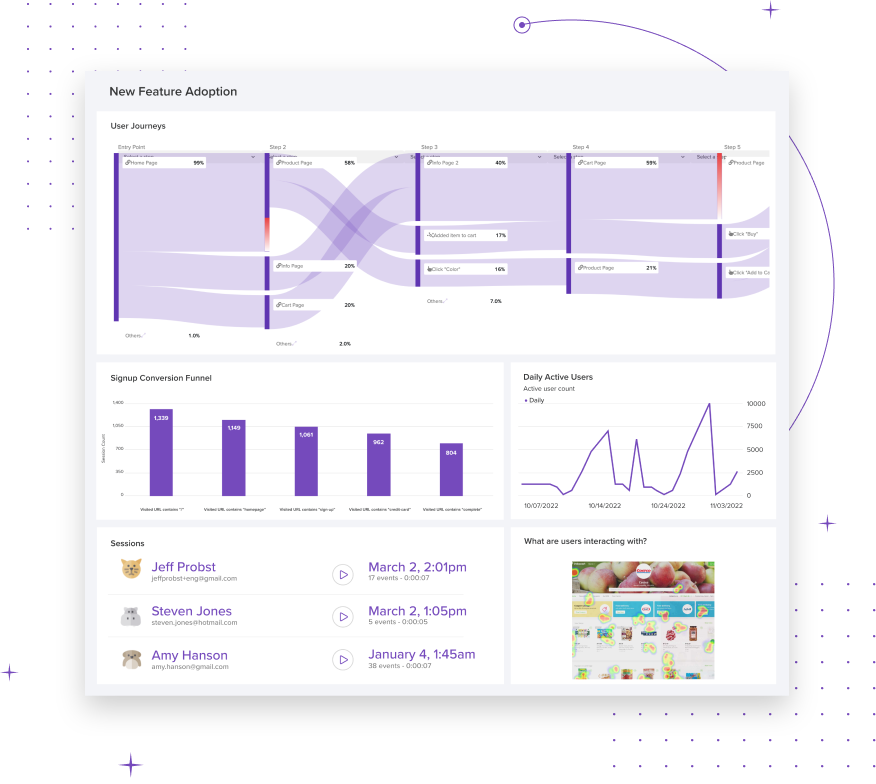
LogRocket captures the same essential metrics as other monitoring tools for web and mobile products, including users, sessions, pages visited, UTM tags, conversions, and much more. You can then see this data displayed in charts, dashboards, heatmaps, and other common visualization structures to help you answer product-related questions, such as what user journeys look like, what’s driving retention, or where friction is happening.
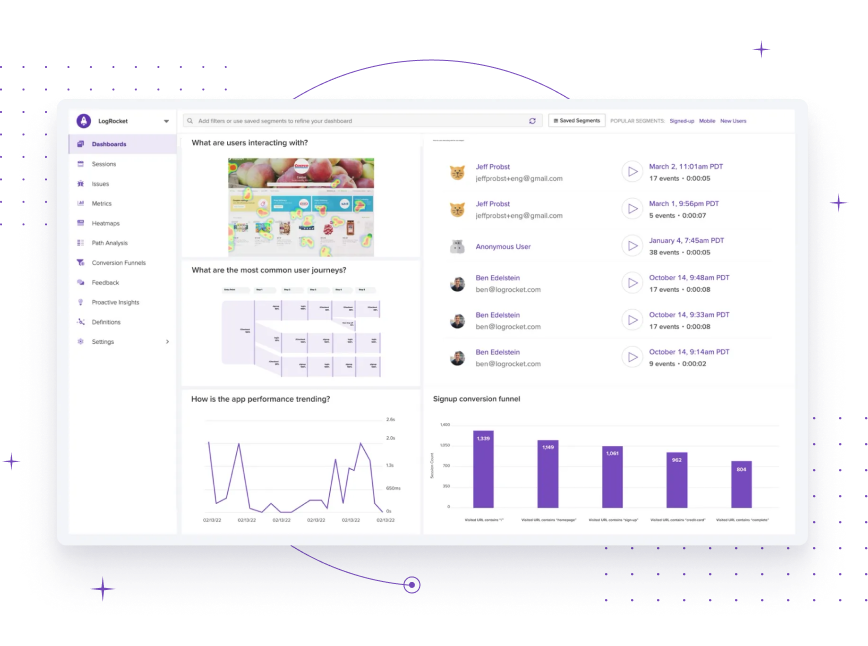
Use prebuilt templates for charts and dashboards to start answering questions quickly, modify them to suit your needs, or create completely custom ways to track the specific product features you’re most interested in. Answer essential questions about your product on the fly or save your charts and dashboards to see how metrics change over a given period.
Tracking your KPIs over time can help you identify trends and issues, compare differences across user cohorts to hone in on focus areas, or monitor product performance, usage, and anything else you need. You can then easily share these insights with executives and other teams, or keep your dashboards private while you experiment with what’s possible.
Filter and search capabilities
You can use LogRocket’s powerful filters to easily find specific sessions and refine charts using over 50 filter options, including user information, session metadata, session activity, technical performance, and other properties.
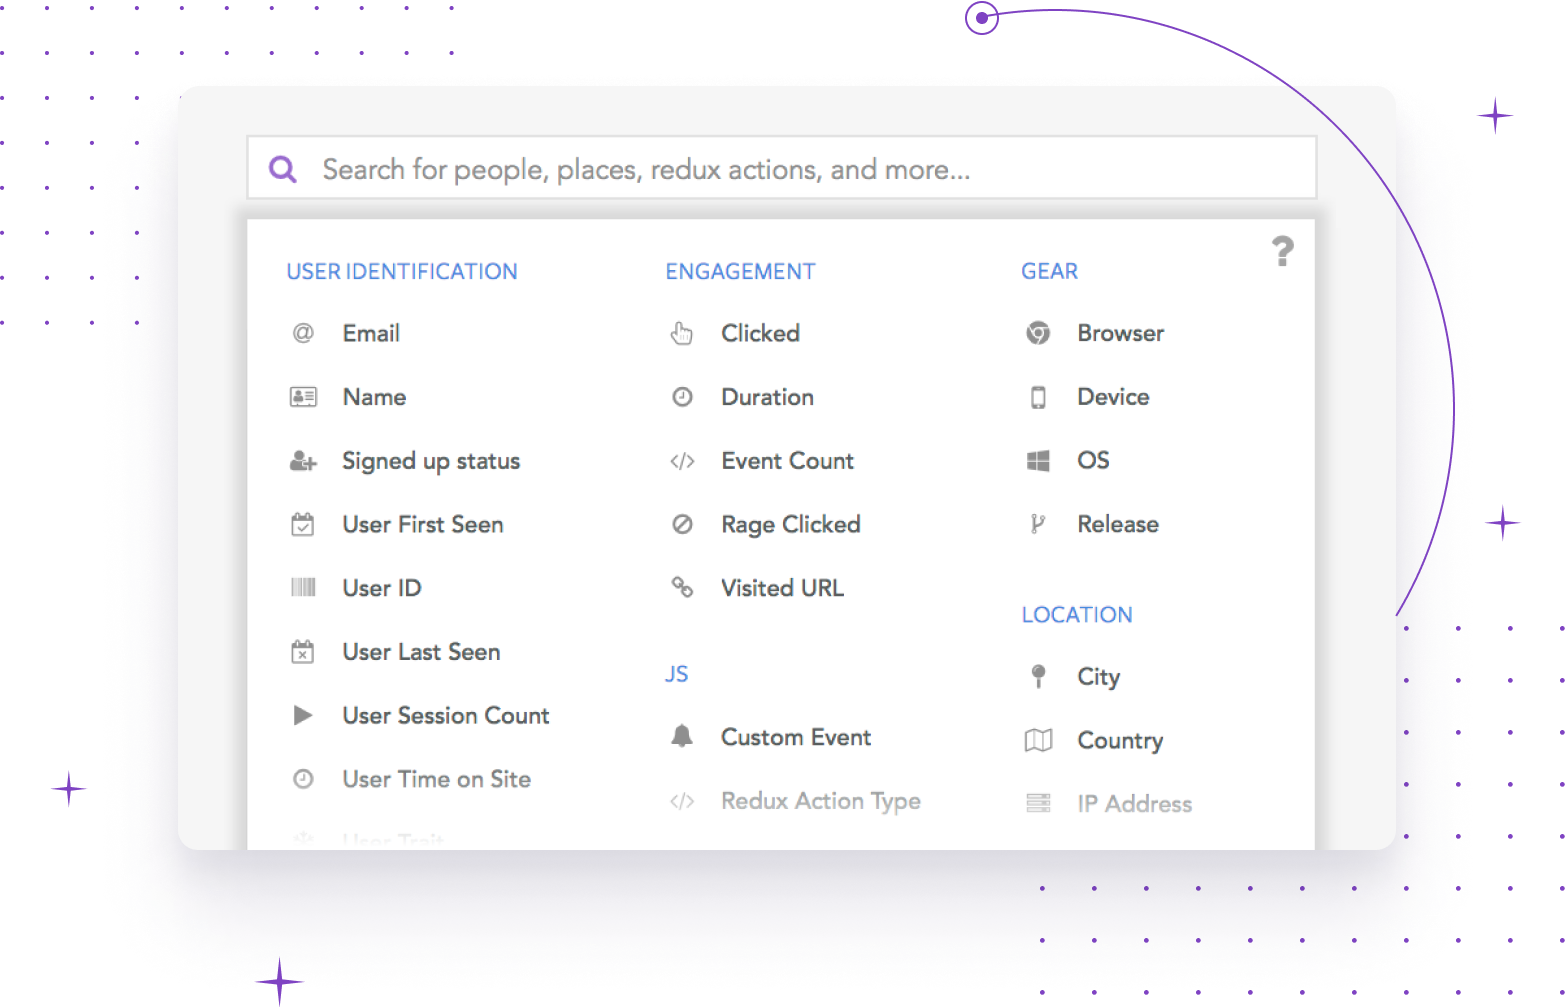
Combine and save filters to create unique user cohorts for a more granular look at how users interact with your apps. Apply them to individual charts to answer specific questions about user behavior, or to entire dashboards to understand how key metrics vary by target cohorts.
Security and data privacy
Many product analytics tools that include a session recording feature collect data from customers first before sanitizing personally identifiable information (PII) and protected health information (PHI). This means they end up storing data customers want to protect — a potentially serious problem, especially in highly regulated industries like healthcare and fintech.
LogRocket never collects data you don't want us to because that data is never sent to us. Data sanitization happens in the browser, pre-capture, so it's never ingested by us in the first place.
Besides automatically obscuring private fields such as passwords and credit cards, LogRocket gives you the ability to choose which other fields or elements you want to exclude. As a result, this sensitive data won't ever be recorded or sent to our servers.
"LogRocket helps us get that level of product sophistication without compromising our ability to be HIPAA-compliant and maintain strict data and patient privacy requirements we have as a company." – Antares Meketa, CPO at Karuna Health
Exclude additional private fields so that the data never leaves the user’s browser, or redact everything and allow only the fields you want to show. Get the information you need to solve technical issues and improve your product while protecting end-user privacy and complying with regulatory guidelines.
Minimal impact on performance
Done wrong, on-site product analytics tools can torpedo your app performance and harm the user experience in a serious way. LogRocket’s lightweight product analytics platform was designed from day one to have a low impact on performance while giving you all the information you need to improve your digital product.
LogRocket uses just two lines of code or an npm package to reconstruct user sessions by sending a minimal amount of data asynchronously. It leverages a worker thread to ingest the product analytics data you need while minimally impacting site performance.
Try LogRocket product analytics for free!
Start your free trial now to see how LogRocket can empower your team to collaborate effectively and create the ideal product experience for your users.
Install LogRocket in under 3 minutes. Get free access to all features for 14 days. Cancel at any time.